
The government says that America’s poverty rate is 11.8 percent. It also says that the poverty rate has hovered around 11 to 15 percent since 1970 suggesting little or no progress against poverty in decades.
But the Census Bureau’s official poverty rate is biased upwards and kind of meaningless. In terms of material well-being, families near the bottom are much better off today than in past decades because of general economic growth and larger government hand-outs.
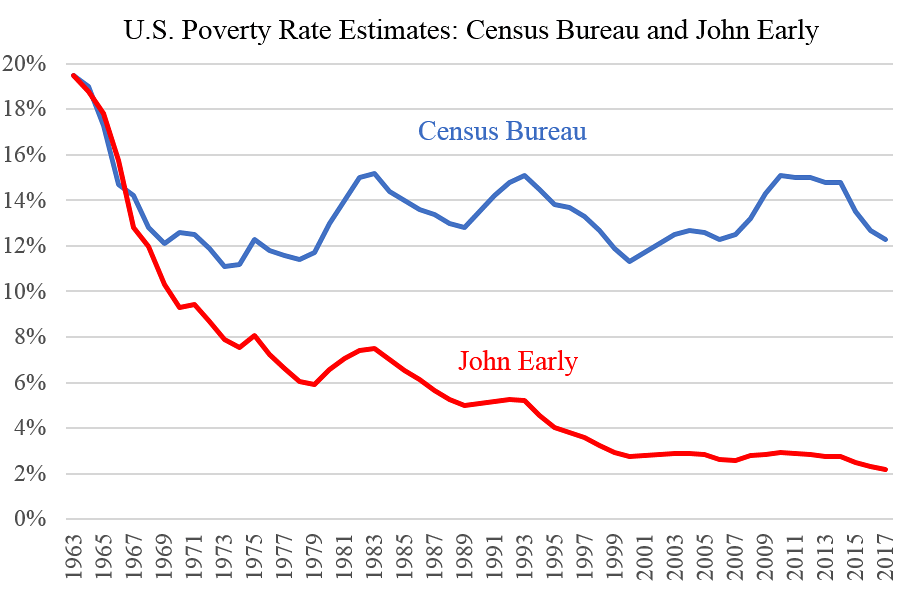
In a Cato study, John Early recalculated the U.S. poverty rate using more complete data and found that it fell from 19.5 percent in 1963 to just 2.2 percent in 2017. (The study’s charts are updated here.) Early is a former Assistant Commissioner of the Bureau of Labor Statistics.
Bruce Meyer and James Sullivan perform a similar exercise in this new study. They find that the poverty rate fell from 13.0 percent in 1980 to 2.8 percent in 2018. Meyer-Sullivan calculate their figure based on consumption rather than income, but the general idea is the same. Meyer is at the University of Chicago and Sullivan is at the University of Notre Dame.
The Early and Meyer-Sullivan estimates are charted below. Both estimates reflect a large reduction in material deprivation for less fortunate Americans. Unfortunately, this great news about the American economy is usually ignored in media reports and political discussions.
Both Early and Meyer-Sullivan use a more accurate inflation measure than the one used for adjusting the official poverty rate each year. And they both correct for the fact that the Census—in its main poverty series—excludes numerous government benefits including Medicaid, food stamps, and earned income tax credits. Both studies make a number of further adjustments.
The charts below show the Early and Meyer-Sullivan poverty rates compared to the official Census series. Note that all poverty rate calculations stem from essentially arbitrary poverty thresholds measured in relation to a chosen base year. John Early anchors his series to the official rate in 1963. Meyer-Sullivan anchor their series to the official rate in 1980.
The important thing is not the calculated poverty rate in any particular year but the trend over time. The official series shows no sustained improvement in poverty in recent decades, while the better estimates from Early and Meyer-Sullivan suggest large gains for households near the bottom.
In sum, using somewhat different methods, Early and Meyer-Sullivan both show that the official poverty data is far too pessimistic.
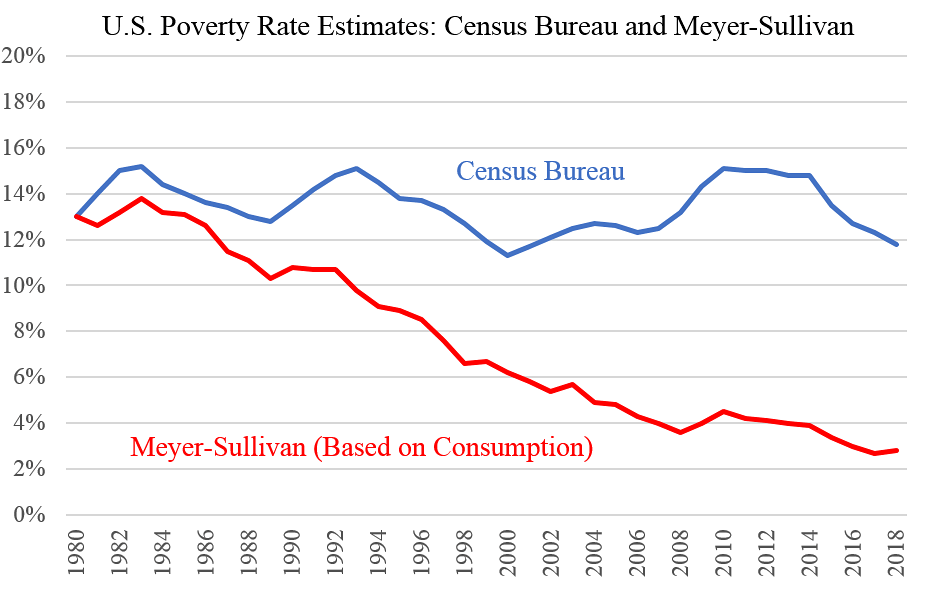
I interpolated the value for 1982 in Meyer-Sullivan.
This originally appeared in Cato at Liberty.