The Earth was 608 percent more abundant in 2020 than it was in 1980.
Gale L. Pooley, Marian L. Tupy —
Does population growth lead to greater resource scarcity, as argued by the English scholar Thomas Malthus and, more recently, by the Stanford University biologist Paul Ehrlich? Or does population growth make resources more abundant, as argued by the University of Maryland economist Julian Simon? The Simon Abundance Index measures the relationship between population growth and the abundance of 50 basic commodities, including food, energy, materials, minerals, and metals.
Main findings:
Global resource abundance increased by 5.9 percent in 2020, according to the 4th annual Simon Abundance Index. The base year of the index is 1980, and the base value of the index is 100 percent. In 2020, the index reached 708.4 percent. In other words, the index rose by 608.4 percentage points over the last 40 years, implying a compound annual growth rate in resource abundance of around 5 percent and doubling of global resource abundance every 14 years or so.
The Simon Abundance Index is measured in time prices. To calculate a commodity’s time price, the nominal price of a commodity is divided by the global average nominal hourly wage. Over the last 40 years, the average nominal price of the 50 commodities rose by 51.9 percent, and the global average nominal hourly wage rose by 412.4 percent. So, the average time price of the 50 commodities fell by 75.2 percent.
The personal resource abundance multiplier is calculated by dividing the average time price of the 50 commodities in 1980 by the average time price of the 50 commodities in 2020. The multiplier tells us how much more of a resource a person can get for the same hours of work between two points in time. We find that the same hours of work bought one unit in the basket of 50 commodities in 1980 and 4.03 units in the same basket in 2020.
The average inhabitant of the planet’s personal resource abundance rose by 303 percent. The compound annual growth rate in personal resource abundance amounted to 3.55 percent, implying that personal resource abundance doubled every 20 years.
Over the last 40 years, the average time price of the 50 commodities fell by 75.2 percent, and the world’s population increased by 75.8 percent. So, for every one percent increase in the world’s population, the average time price of the 50 commodities decreased by almost one percent (i.e., -75.2 percent ÷ 75.8 percent = -0.992 percent).
Note that the personal resource abundance analysis looks at resource abundance from the perspective of an individual human being. The question that we aim to answer is: “How much more abundant have resources become for the average inhabitant of the planet?”
Population resource abundance analysis, in contrast, allows us to quantify the relationship between global resource abundance and global population growth – a question that’s central to the disagreement between Malthus and Ehrlich on the one hand and Simon on the other hand.
You can think of the difference between the two levels of analysis by using a pizza analogy. Personal resource abundance measures the size of a slice of pizza per person. Population resource abundance measures the size of the entire pizza pie.
The population resource abundance multiplier is calculated by multiplying the change in personal resource abundance with the change in global population (i.e., 4.03 x 1.758). The multiplier of 7.08 corresponds to the 708.4 percent increase in Simon Abundance Index. It indicates an increase in the global resource abundance of 608.4 percent at a compound annual growth rate of around 5 percent. As such, we estimate global resource abundance doubles every 14 years or so.
Figure 2: Visualization of the relationship between global populationgrowth and the abundance of the 50 basic commodities (1980-2020)
Finally, let us say a few words about the resource abundance elasticity of population. In economics, elasticity measures one variable’s sensitivity to a change in another variable. If variable X changes by 10 percent, while variable Y, as a result of the change in X, changes by 5 percent, then the elasticity coefficient of X relative to Y is 2.0 (i.e., 10 ÷ 5). A coefficient of 2.0 can be interpreted as a two percent change in X corresponding to a one percent change in Y.
We found that every one percent increase in population corresponded to an increase in personal resource abundance (i.e., the size of the slice of pizza) of 4 percent (i.e., 303 ÷ 75.8). We also found that every one percent increase in population corresponded to an increase in population resource abundance (i.e., the size of the pizza pie) of 8.03 percent (608.5 ÷ 75.8).
Conclusion:
We found that humanity is experiencing what we term Superabundance – a condition where abundance is increasing at a faster rate than the population is growing. Data suggests that additional human beings tend to benefit, rather than impoverish, the rest of humanity. That vindicates Julian Simon’s observation that:
There is no physical or economic reason why human resourcefulness and enterprise cannot forever continue to respond to impending shortages and existing problems with new expedients that, after an adjustment period, leave us better off than before the problem arose.… Adding more people will cause [short‐run] problems, but at the same time there will be more people to solve these problems and leave us with the bonus of lower costs and less scarcity in the long run.… The ultimate resource is people—skilled, spirited, and hopeful people who will exert their wills and imaginations for their own benefit, and so, inevitably, for the benefit of us all.
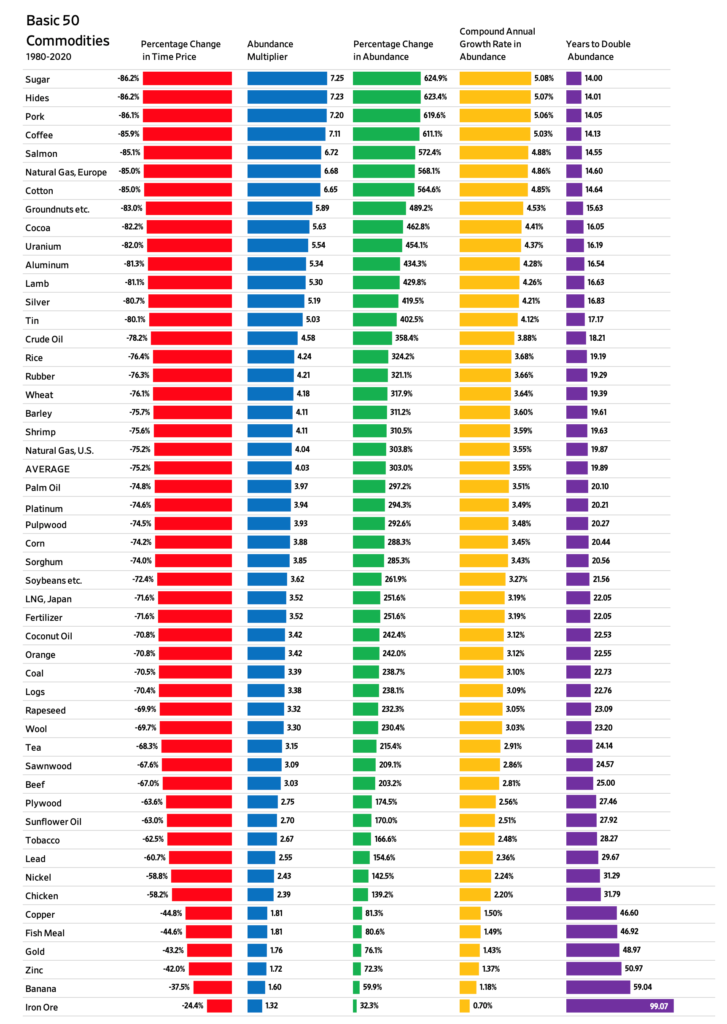
Figure 3: Changes in the time prices and the abundance of the basic 50 Commodities (1980 to 2020).