
Paul Ehrlich is a notorious doom-monger who has repeatedly predicted mass starvation and resource depletion due to overpopulation. His latest complaint is that the UN summit on food systems ignored the population issue. This article refutes Ehrlich’s claims and shows how food abundance has increased dramatically over the past four decades thanks to market-driven innovation and efficiency.
Paul Ehrlich can’t admit when he’s wrong. In his 1968 book, The Population Bomb, Ehrlich predicted that “in the 1970s hundreds of millions of people will starve to death” due to unchecked population growth. Instead, people started farming more efficiently. Then, Ehrlich famously lost $576.07 to Julian Simon in 1990 when he made a 10-year bet that five basic metals would increase in price. The five-metal basket actually fell in price by an average of 36 percent, despite the global population increasing by 800 million.
Nevertheless, Ehrlich is still ringing the population alarm. This month, he complained in the journal Nature that overpopulation was not mentioned as a factor in a recent UN summit on food systems. While it is true that some places still suffer from food scarcity, these shortages tend to be temporary or politically driven. The fact is, food has never been more abundant, and the population is higher than ever. More people are enjoying more calories from a greater variety of food than any other time in history.
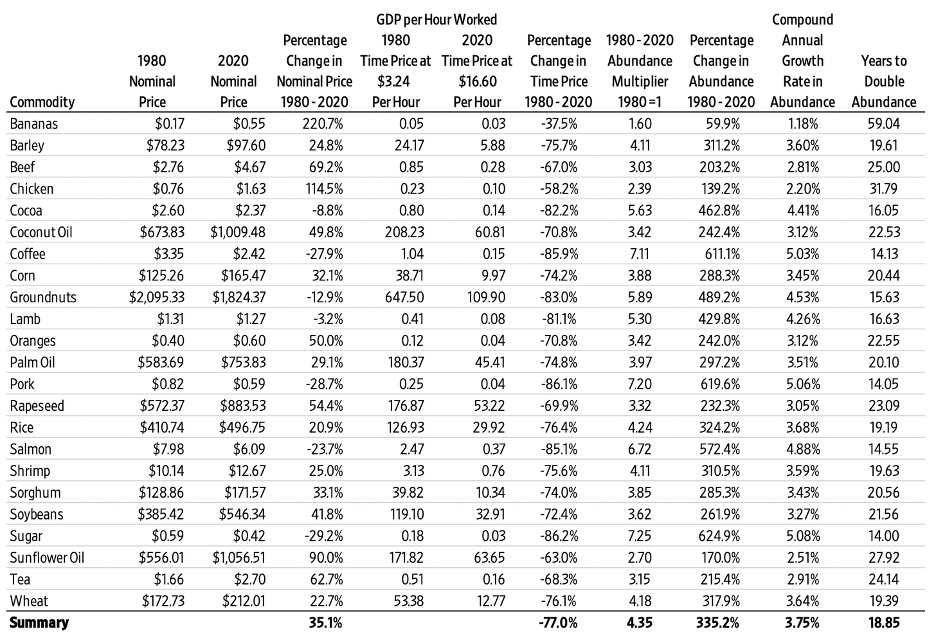
Ehrlich made his bet with Simon in 1980, so let’s look at what’s happened with food abundance since that date. The World Bank and the IMF track global prices on 24 basic food items from bananas to wheat, coffee to rice, and salmon to sugar. We first calculated the “time price” for each of these food items each year. Time prices are superior to money prices for a host of reasons. A time price is simply the amount of time required to earn the money to buy an item. While money prices are expressed in dollars and cents, time prices are expressed in hours and minutes. Put more concretely, time prices equal the nominal price divided by hourly income. We estimated global hourly income by calculating GDP per Hour Worked using data from the World Bank and the Conference Board.
Let’s look at wheat for an example of how time prices work. The nominal price of a metric ton of wheat in 1980 was $172.73 and GDP per hour worked was $3.24, indicating a time price of 53.38 hours. In 2020 the nominal price had increased to $212.01 per metric ton, but GDP per hour increased to $16.60, so the time price had decreased to 12.77 hours. This represents a 76.1 percent decrease. For the time required to earn the money to buy one ton of wheat in 1980, you would get 4.18 tons in 2020. This means that, between 1980 and 2020, wheat became 317.9 percent more abundant, indicating a 3.64 percent compound annual growth rate. At this rate, wheat abundance would double every 19.39 years.
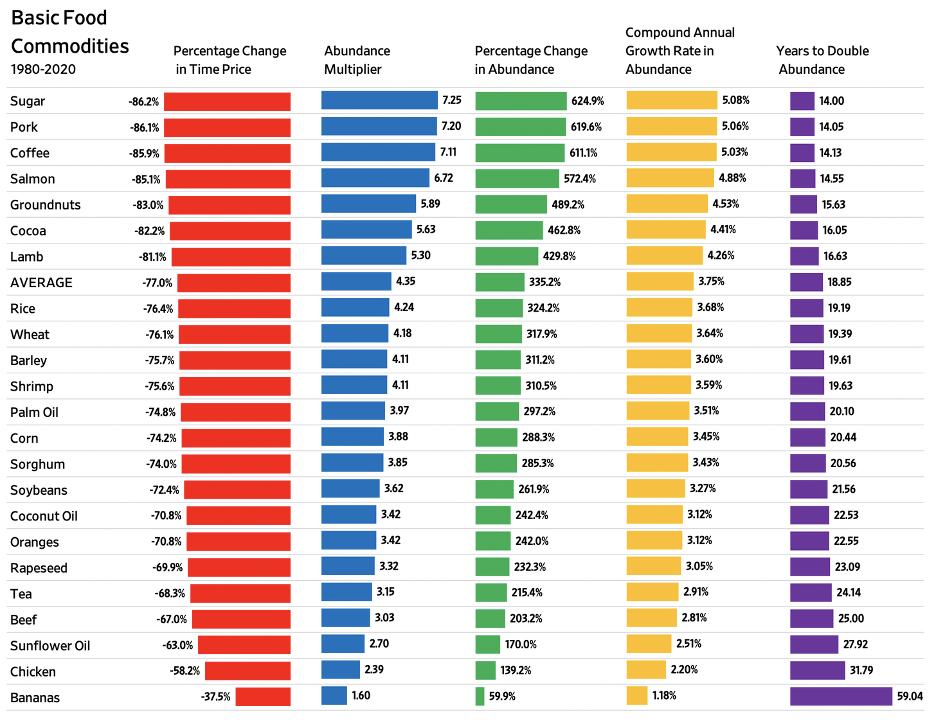
While the average nominal price of these 24 basic foods increased by 35.1 percent, the average time price decreased by 77 percent. Not a single item increased in time price. For the time required to buy one basket of these items in 1980, you would get 4.35 baskets in 2020, meaning personal food abundance increased by an astonishing 335.2 percent. At a compound growth rate of 3.75 percent a year, personal food abundance doubles every 18.85 years.
Measuring Global Food Abundance
We can think of global food resources as the product of personal food abundance multiplied by how many people there are. This can be illustrated in a graph with population on the horizontal axis and food abundance on the vertical axis. If we index the 1980 population to a value of one and food abundance to a value of one, the 1980 global food would be a one-by-one box. This is represented by the red box.
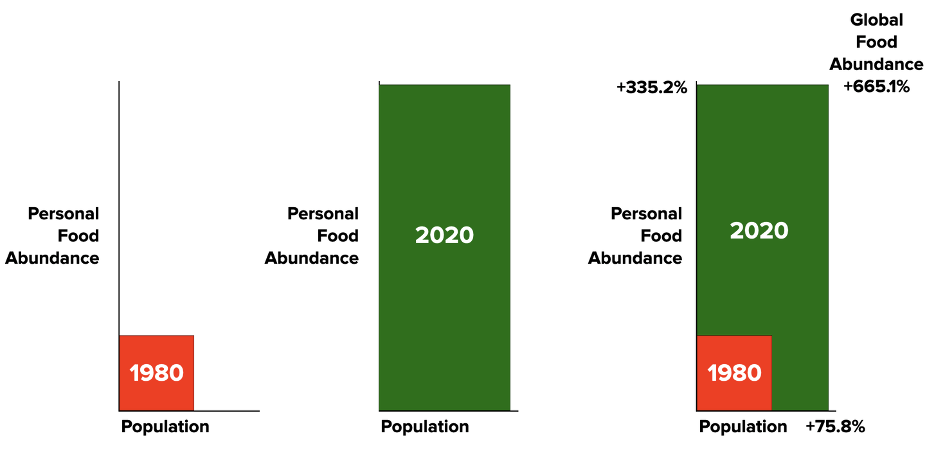
We then draw 2020 as a green box. From 1980 to 2020, the global population increased 75.8 percent, from 4.434 billion to 7.795 billion. So, population on the horizontal axis increases from a value of 1 in 1980 to 1.758 in 2020. Since personal food abundance increased by 335.2 percent during this same period, it increases on the vertical axis from a value of 1 to 4.352. The area of the green box represents global food abundance, which increased to a value of 7.651 in 2020 (1.758 x 4.352). Overlaying the 1980 red box on the 2020 green box shows that global food abundance grew 665.1 percent, from an indexed value of one in 1980 to a value of 7.651 in 2020.
Food Abundance Elasticity of Population
Now we turn to the relationship between food abundance and population. Over this 40-year period, personal food abundance increased by 335.2 percent, while global food abundance increased by 665.1 percent. Since the population increased by 75.8 percent, every one percent increase in population corresponded with a 4.42 percent increase in personal food abundance and an 8.77 percent increase in global food abundance. It’s as if more people are creating exponentially more food to share with the rest of us.
Conclusion
The lesson for Ehrlich and company is don’t bet against human beings that are free to create and innovate. While there are still lots of problems on our planet, we have made astonishing progress in lifting ourselves out of poverty and feeding one another.